Desert Online General Trading LLC
Dubai, United Arab Emirates
Desert Online General Trading LLC
Dubai, United Arab Emirates

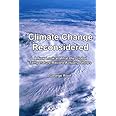
Climate Change Reconsidered: A New Look at What the Global Temperature Record Actually Shows
G**O
The Global Warming scare put back in its box!
The 'Global Warming Religion' scam exposed. No one believed Darwin at the time either.
G**F
A worthy insightful analysis of climate variability, but with limitations.
This short book provides an interesting and useful consideration of the various climate cycles, from the decadal to the millennial time scale.I initially bought the Kindle version, but later also bought the printed book, with the expectation the graph would be clearer, which they were, but also reduced to shades of grey. If you have a Kindle reader I would suggest that is the better and significantly cheaper option.It is the first analysis I have seen that attempts to differentiate between the natural climate cycles and manmade global warming, such as due to manmade CO2.The author does not concern himself with what causes the natural cycles, but simply assumes they exist and then uses least squares curve fitting to determine the period, magnitude and phase of the various natural cycles, with a small constant offset to ensure consistency. It then analyses the residuals for any “recent” linear global warming effect, which may be attributed to manmade CO2 emissions. The remaining residuals are then attributed to random weather variations.The climate temperature offset, relative to an arbitrary reference, for available climate temperature data, from 1500 onward, is decomposed to four sine wave cycles, with linear CO2 warming from some start date.The analysis was achieved a curve at a time, starting with the longest sine period, and then fitting the next curve to the resulting residuals. This method is ok if the fitted functions are near orthogonal to each other. I have found that after approximately normalising the diagonal terms of the full least squares solution matrix, the maximum off-diagonal term was less than 3%. Thus the fitted functions were close to orthogonal. So given the other uncertainties the curve fitting method used was reasonable.The author makes the presumption that the climate variations are mostly due to fixed and on-going cycles, of fixed periods and amplitudes, plus a linear term for CO2 warming. He disputes that climate behaviour is chaotic.My understanding is that any nonlinear dynamic system with more than three variables, with self-induced oscillations is very likely to be chaotic in its behaviour. It is unlikely to have cycles of consistently fixed periods and amplitudes, unless there is some exterior forcings with the relevant periods.One only has to consider the simple Lorenz system, to see that even a simple, but nonlinear, dynamic system, with just three variables, can exhibit chaotic cyclic behaviour, where the resulting cycles do not have fixed periods and amplitudes in the way assumed in this book. Hence the very complex and non-linear climate system, with a multitude of variables and non-linear relationships, is almost certain to exhibit chaotic behaviour.Even a lightly damped linear second order system driven by white noise is unlikely to exhibit the stability of cycle period and amplitude assumed in this book.So the analysis may be considered a bit simplistic, even a bit naïve, but that said this is a worthy effort to extract what insight can be gained from the climate data available, without preconceived ideas about what determines the climate behaviour.The earlier data used was from Craig Loehle, and the more recent data was HadCRUT4.The period and magnitude for each cycle is given. The zero crossing time, or phase, for each cycle is not given, so was deduced from the various graphs. The resulting values are listed below, and these were used to reconstruct the “Combined cyclic model” developed by the author.Constant offset = 0.09CSine 1: Period = 1350 years, Amplitude = 0.725 C, Upward zero 2000Sine 2: Period = 247 years, Amplitude = 0.106 C, Upward zero 1966Sine 3: Period = 66 years, Amplitude = 0.130 C, Upward zero 1990Sine 4: Period = 9 years, Amplitude = 0.042 C, Upward zero 1940Linear Trend, after 1950 = 0.23 C/ century , Zero start 1950Residuals weather: 0.1C (1standard deviation)The fourth Sine4 term has a period of 9 years with an amplitude of 0.04C, perhaps representing one of the shorter decadal ocean oscillations. However the method of analysis, assuming a constant frequency, resulted in a very small amplitude for this, compared with what might have been expected. Relative to the final residuals, with a standard deviation of 0.1C, this last sine term was essentially buried in the random weather fluctuations, so not much significance is given to this.The most interesting part of this was the attempt to separate out any global warming effect, perhaps due to manmade CO2, from the natural climate cycles and random weather variability.After least square fitting of the natural cyclic variations, there was an anomalous residual, from about 1950 to the end of the data, about 2013 (63 years), which was attributed to CO2 warming. When extracted, this had a rate of about 0.23C per century, an order of magnitude smaller than the IPCC has been claiming with ever increasing “certainty”.Relative to the random residuals, of 0.1C rms, the global warming over this 63 year would be 0.145C, thus the confidence for the warming rate would not be high. So it would be reasonable to presume the rate could lay between zero and 0.46C per century, but still well below what the IPCC have been claiming.This is despite “heat island” effects and the fiddling about with the HadCRUT climate data to make global warming seem worse than it actually is, as shown by comparison with the satellite measurements.Within limitations, this allows one to consider the possible future climate trends, by extrapolating the fitted function into the future, at least to the end of the century, or more speculatively beyond that.The analysis shows that after a climate temperature increase of about 0.6C, since about 1970, we have now reached a plateau, peaking in 2014 to 2015. Over the next 20 years it would seem we can expect a small amount of climate cooling, by about 0.1C, in complete contradiction to the IPCC prediction of on-going climate warming. Beyond that, up to 2070, there could then be some further warming, by about 0.4C, to around 0.3C above where we are now, then falling back by about 0.2C by the end of the century, to be just about 0.1C above the present climate temperature.This “Cyclic Model” indicates that by the end of the century the climate temperature increase is likely to be no more than about 1C above that during the 19th century, even with manmade CO2 global warming, well below the IPCC claims made with such certainty.What is most interesting is the longest and largest cycle, with a period of 1350 years. Projected back in time, this is reasonably consistent with the timing of the Medieval Warm period, around 1000 years ago. It indicated we are about halfway between the mini ice age and the next substantial warm period, in about 340 years, when it will be about 0.3C warmer than now without CO2 warming, or 0.7C to 0.8C warmer with CO2 warming, still well below the IPCC predictions.Extrapolated further into the future, it indicates that even with the anticipated on-going exponential increase in manmade CO2 emissions, it could take another 400 years before we reach the supposedly 2C increase, which the IPCC claim will have a catastrophic tipping effect on the climate. Well before then we will almost certainly have found an effective sustainable alternative form of low CO2 source of energy. We will have long since forgotten the present manmade global warming scare, on which so much time, effort and valuable resources have been needlessly squandered, to the great detriment of our people and economy, which is what has really put the future of our children and grandchildren at risk.
Trustpilot
2 months ago
1 day ago